|
Have you ever baked cookies in the oven without preheating the oven first and expected them to be finished within the same time the directions said? Do you remember how they came out? I've done this before because I was too impatient to wait for the oven to preheat. My cookies were raw...not finished, mushy...If I wanted them to taste right, they would need to stay in the oven longer. I would like to argue that when we don't build background for students, we are essentially doing the same thing. Building background is like preheating the oven. It prepares the brain for the new learning that is going to take place. When we preheat (or build background) we are prepared to receive new information more readily. If we skip this essential step, we are risking that it will take longer for students to comprehend and the new learning may not stick. Research says that when students have some knowledge of a topic they can better remember it and go into detail regarding the topic (Chiesi, Spilich, & Voss, 1979). Sometimes, as teachers, it's necessary for us to build background for our students when they don't have any. Years ago I attended a 6 Day Project GLAD (Guided Language Acquisition Design) training. It was then that I was introduced to Observation Charts. They are a simply yet effective way to build background for students using images and cooperative groups. I love this technique for all students but specifically for English Language Learners because it involves the use of visuals and talk. Visuals are one of the best ways (in my opinion) to make content comprehensible and speaking is critical for ELLs in all academic areas. (On a side note-I loved and believed in Project GLAD so much that I later became a trainer myself.) Here's how to implement this instructional technique in your classroom:
Sometimes I don't like to put the pictures on a file folder...I have them loose and hand a set to each group. In this case, they are called Picture File Cards. I let the students work in groups to discuss what they see and categorize them in an open sort. This means they get to decide the categories as long as they can defend them. If I give them the categories, it's called a closed sort. Either way, students are thinking about the content. They are retrieving information they know and preparing to link it to new information. They are hearing their peers talk about it too and often hearing new vocabulary. For instance, one student may say, "I see a home. I think it's called a teepee." While another may say, "I see a shelter." They are picking up many ways to say the same thing. Observation Charts can be used in all grade levels. I have seen them used in kindergarten through fifth grade. But I know they can be used up to 12th grade. Any area of study would lend itself to Observation Charts. Picture different composers, instruments, various forms of art, sports, inventions, animals, shapes, countries, etc. The fact is that Observation Charts lower the affective filter for students which makes learning easier, they help to access prior knowledge and build background while working with cooperative groups or partners. They are a highly engaging way to begin a unit of study and connect old knowledge with new learning. (Note: I will add examples here when I return to work...currently I'm off for Spring Break.) References: Brechtel, M. (2001). Bringing it all together: Language and Literacy in the multilingual classroom. San Diega, CA: Dominie Press. Echevarría, J., Vogt, M., & Short, D. (2008). Making content comprehensible for English learners: the SIOP® model. Boston: Pearson/Allyn and Bacon.
Diana Bishop
11/1/2017 12:29:46 pm
Hi Valentina,
Valentina
11/1/2017 02:45:20 pm
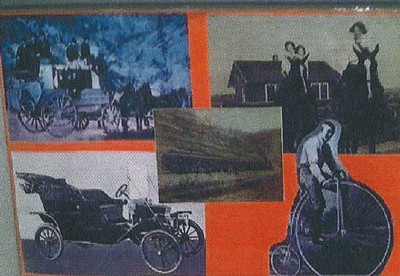
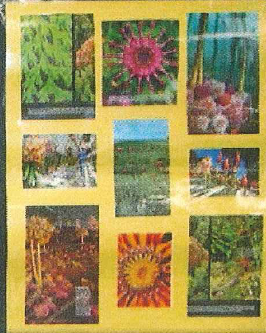
Hey Diana! I added a couple of pics from my district. Unfortunately my own examples were ruined by Hurricane Harvey. :( I prefer making them in file folders. They are just easier to store that way. I apologize for the poor picture quality. Comments are closed.
|
Categories
All
|


 RSS Feed
